Please Sign In to contact this author.
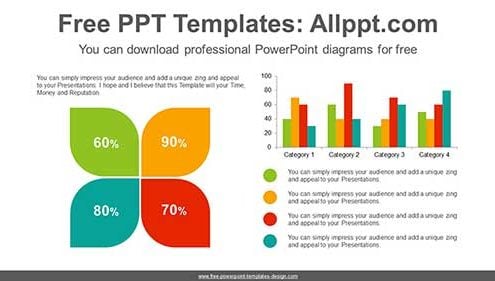
This diagram is a clustered bar graph. This shows the differences between categories or trends over time. Search Keywords:template, presentation, graph, graphic, icons, infographic,…